
Academic leaders routinely make decisions about course offerings, course scheduling, staffing, releases, and other topics that drive curricular efficiency. However, Deans and Chairs often lack convenient access to accurate data about instructional costs. As a result, many have limited, and sometimes incorrect, intuition about instructional economics. Asking them to make good decisions without access to sufficient relevant information is bound to lead to less-than-ideal results.
Curricular efficiency analysis uses detailed operating and financial data to understand the effects of these decisions on instructional cost. Effective curricular efficiency analysis helps reduce teaching workloads in a department and for an entire institution. This can enable an institution to realize at least four benefits:
- Reducing the need to hire new faculty, which in turn can minimize the need to cut elsewhere to pay for these additional or replacement hires
- Freeing up money and faculty time to reinvest in other institutional priorities, such as building new programs, strengthening existing programs, and providing student support to increase success rates
- Minimizing the extent to which budget cuts translate into higher workloads or inferior education
- Making college more affordable for students and other funders
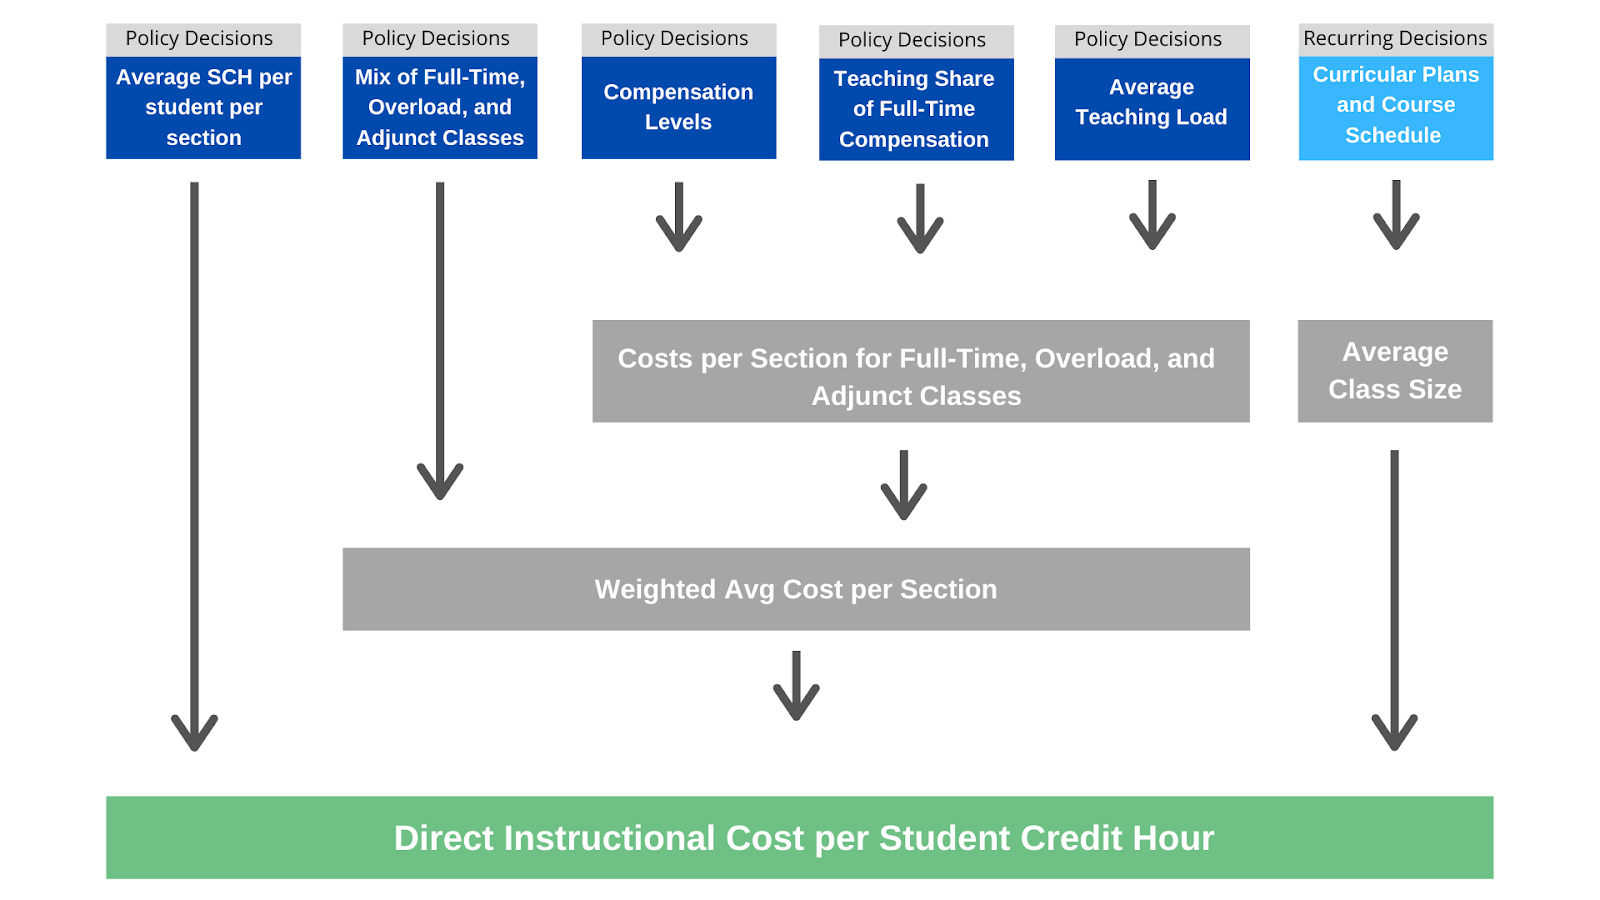
Overall, instructional costs depend on academic cost structure and class sizes. Policy decisions drive cost structure. Recurring decisions drive class sizes. The key to managing curricular efficiency is to improve both policy and recurring decisions.
Click the image to enlarge it.
The diagram above illustrates that cost per SCH is driven by three big factors: what it costs to teach one section of a course, how many credit hours each student earns for that course, and how many students are in that section. Upcoming blog posts on curricular efficiency will focus on these factors:
- Average class size: Recurring decisions that affect the number of students in each section taught
- Weighted average cost per section: Policy decisions around faculty mix, loads, and pay policies
- Credit hours per course: Implications of changing the standard credit-hour value of each course
Improving these decisions will drive the core metric of curricular efficiency: direct instructional cost per student credit hour (cost per SCH). Cost per SCH reflects a few important concepts:
- Costs, not margins, drive curricular efficiency. Individual courses offered seldom affect students’ choice of college. Therefore, curricular efficiency can safely ignore revenue. (Program evaluations should include revenue because programs do attract students).
- SCH is a good measure of instructional output; in a typical 120-credit Bachelor’s degree program, one SCH is 1/120th of the instructional effort. SCH therefore is a consistent increment of what is being paid for by students, private funders, and government support. Curricular efficiency analysis focuses on managing the cost per SCH while helping students master the right educational content and complete their programs successfully.
- Cost per SCH is independent of course level, department size, modality, and other attributes. Therefore, cost per SCH can be used – relatively fairly – to compare efficiency across departments and institutions.
The factors that drive curricular efficiency are the result of decisions that institutions make all the time. Improving the processes for making these decisions is a key to delivering better education at a lower cost.