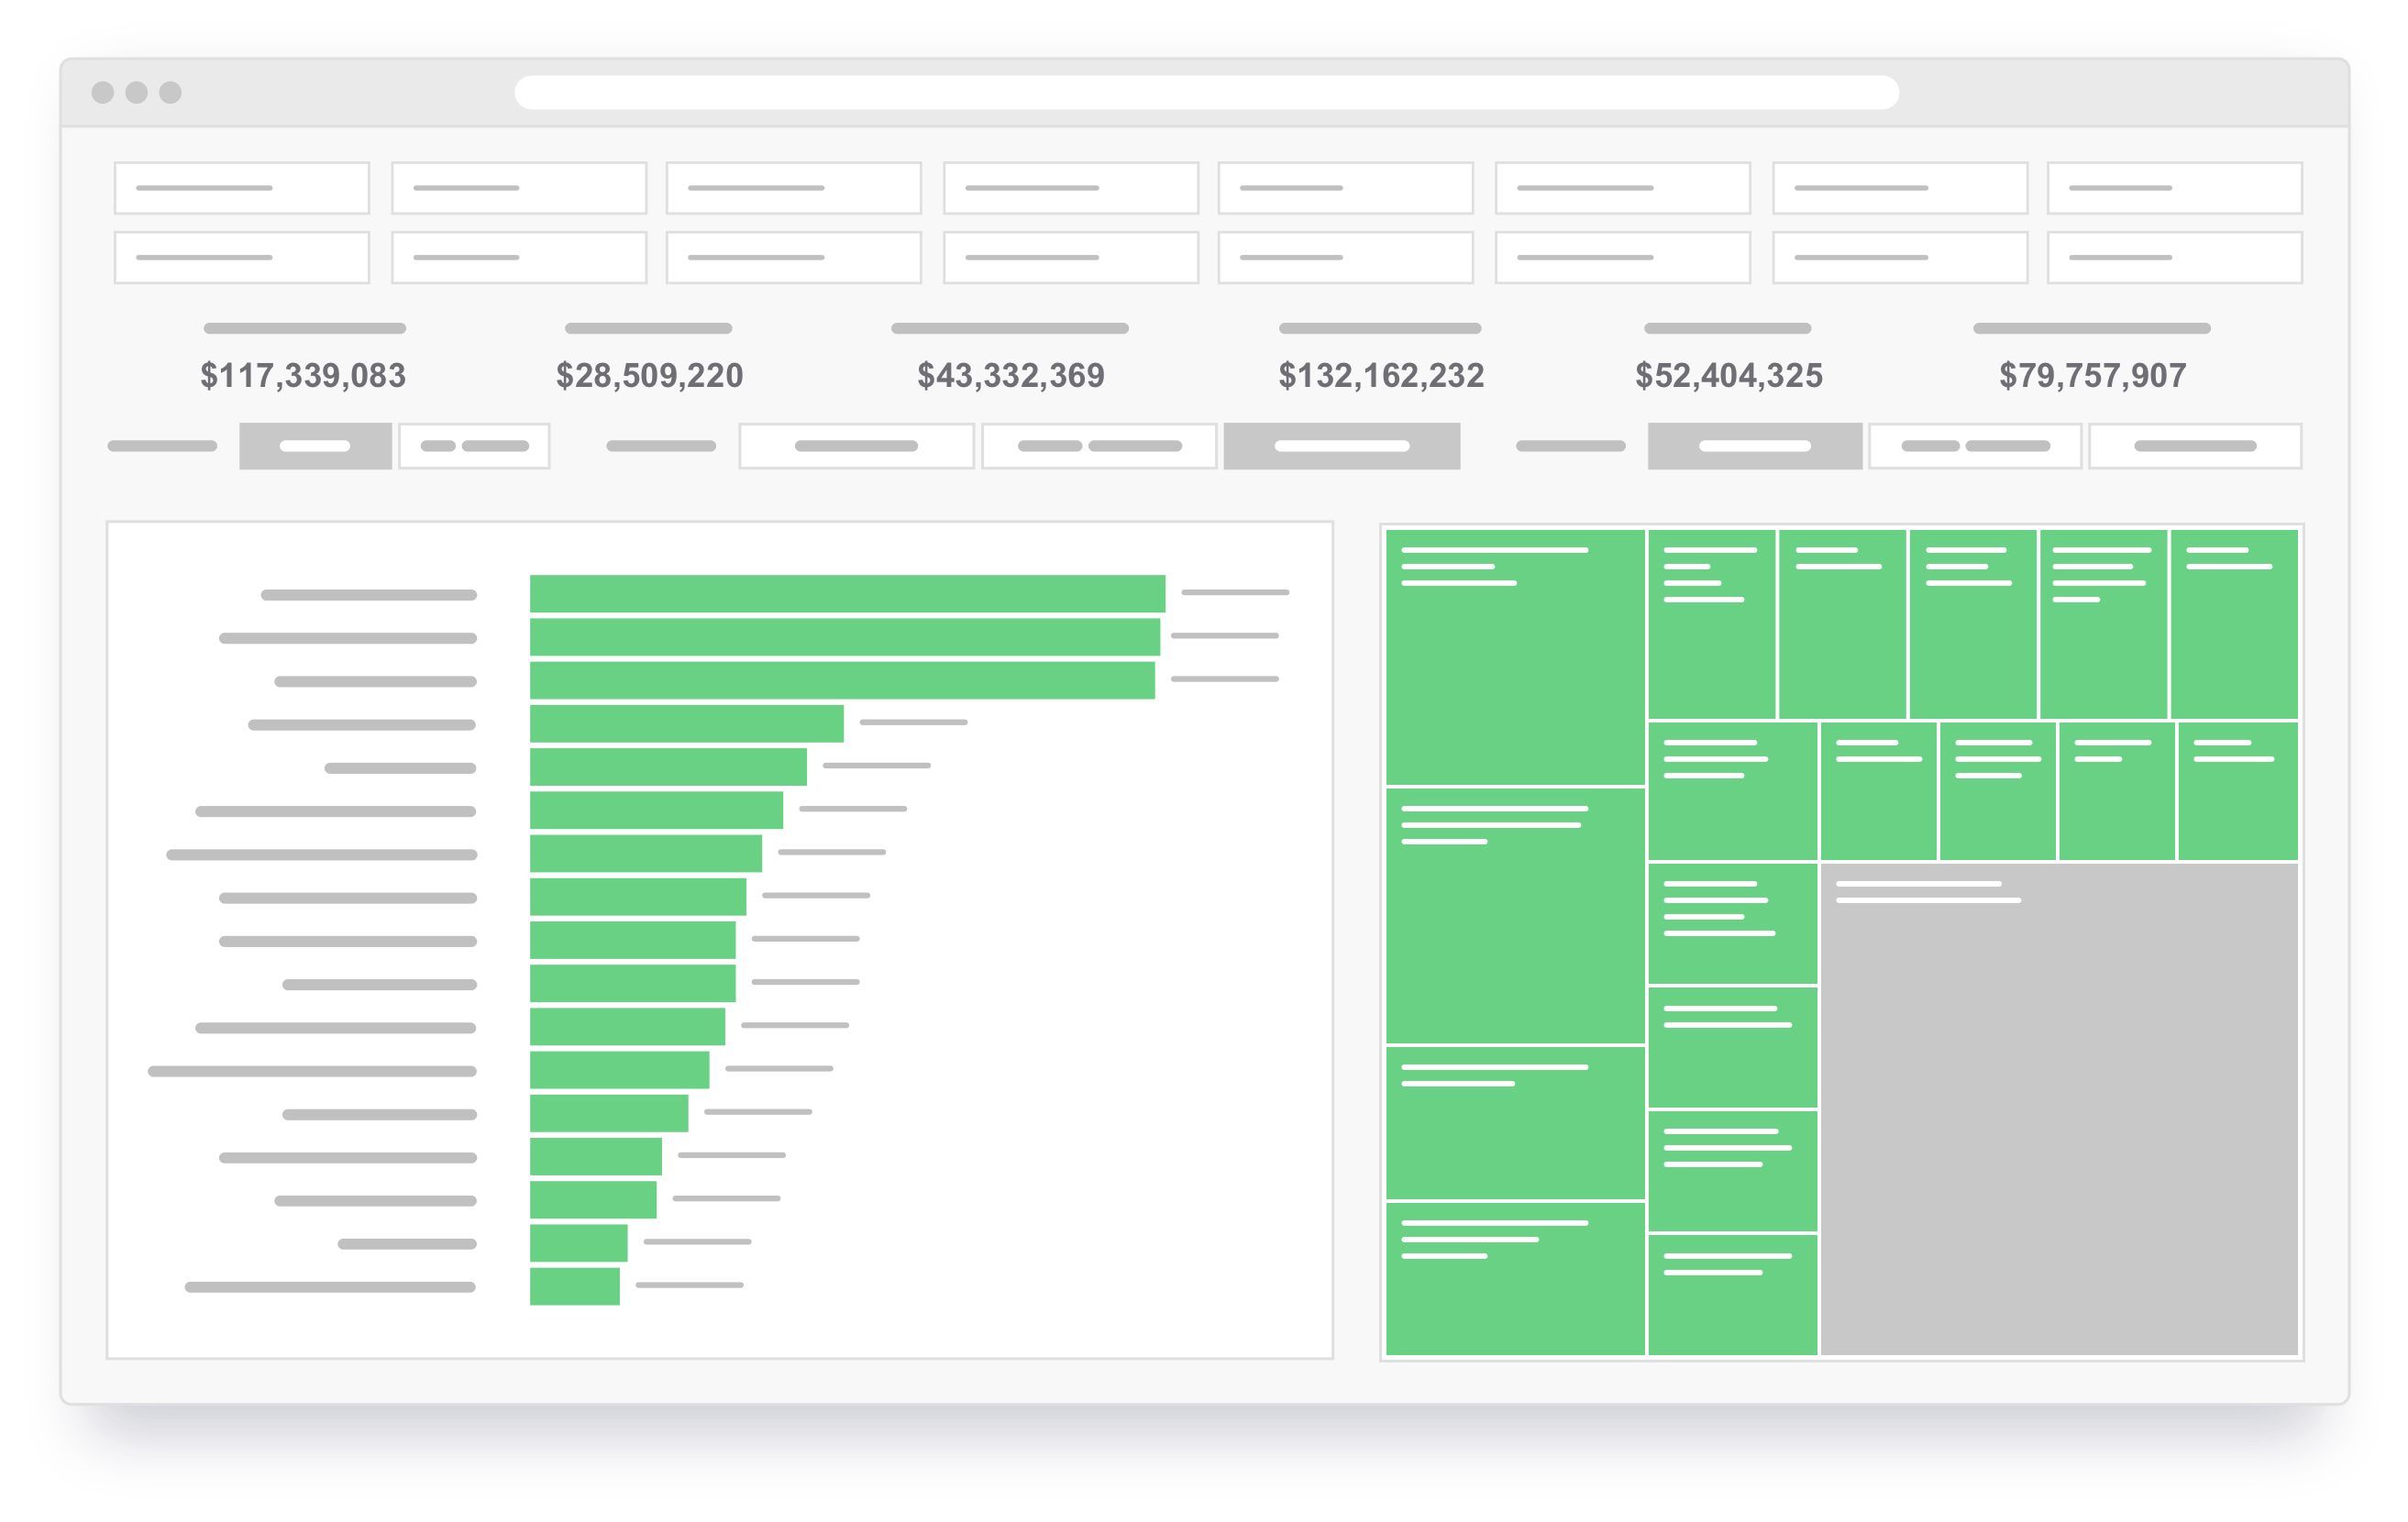
PES Economics and Outcomes tracks program economics, benchmarks, and outcomes.
Economics: Assess revenue, cost, and margin by department, program, and course. Access the data you need to improve curricular efficiency. Benchmark your results by subject and course level.
Outcomes: Assess student outcomes by department, program, race, gender, and ethnicity. Determine which courses and programs retain students and which increase attrition. Identify equity gaps and their causes, so you can improve outcomes across the institution.
Effortless Analysis
The PES Economics and Outcomes scorecard tracks revenue, cost, and margin down to the section level. Clear visualizations enable everyone to understand program economics and improve efficiency.
Intuitive Navigation
Visualize performance metrics across departments, programs, and courses. Dive deeper with customizable data tables and reveal profound insights.
Benchmarking
Set data-informed goals for program improvement by comparing your revenue, costs, margins, and outcomes by course level and subject area with other institutions.
Better-Informed Decisions
Easily access the data you need to make academic resourcing decisions on classes, sections, instructors, and facilities.
Learn more about Gray DI's PES Economics and Outcomes Software
Curricular Efficiency Workshop by Gray DI supports you with the following:
- Cost Management: Utilizes course-level data to identify high-cost, low-margin, or redundant courses, helping in cost reduction and resource optimization.
- Staff Deployment: Assists faculty and administrators in making informed decisions on instructional staff deployment, allowing optimal utilization of critical resources.
- Budget-Informed Decision-making: The data informs budgets and course schedules, contributing to the overall financial health of the institution.

