
How can you properly evaluate student demand for your academic programs? If you are using a single data source to review demand for your programs, you are not getting the whole picture and could be missing out on several opportunities.
Why is Student Demand Important for College Enrollment?
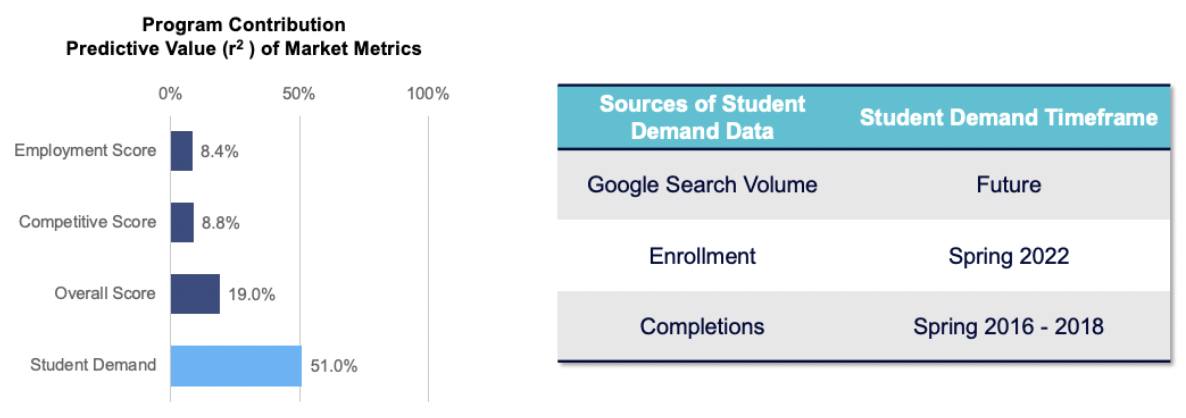
Student demand is one of the best predictors of college enrollment success. Our analysis shows student demand is five times better than employment demand for predicting potential margins for current or new programs. This makes it critical to review when managing your academic program portfolio.
Build the programs that students want.
Three Data Metrics (Sources) for Student Demand Data Analysis
Gray’s Customer Success team works daily with colleges and universities, empowering decision-makers to review their data and make proactive academic program decisions. They recommend taking a proactive approach using more than one data source as needed. The alternative is using a reactive approach based on a single source in isolation, resulting in incomplete analysis and poorly – informed decisions on which programs to start, stop, or grow.
Using three data sources reveals the full continuum of students’ decision-making. They reveal what prospective students are searching for, what they actually choose to enroll in, and which programs they complete. They give you a full picture of student demand as you evaluate academic program enrollment opportunities.
Let’s take a look at the three data metrics you should be using to evaluate student demand for your academic programs.
- IPEDS Completions: This shows how many students went on to complete individual programs.
- Enrollment Data: This shows the volume of actual enrollment for individual programs.
- Google Search Volume: This shows the most up-to-date data for the programs students are looking for right now, including new and emerging programs.
IPEDS: Programs Students Complete
The Integrated Postsecondary Education Database (IPEDS) provides reasonably comprehensive and accurate data on past student demand. All higher-education institutions that receive Title IV funding (federal student loans) file their completions with IPEDS. The data is available by institution, academic program, ethnicity, gender, and other dimensions. Best of all, it is free.
But It is not current. The most recent data was posted in 2021 (for the academic year 2020-2021). As you know, students have to pick their majors or certificates years before they complete them, roughly 3-5 years before they complete a bachelor’s degree, and 2-3 years before completing an associate degree. As a result, the most recent IPEDS completions indicate what students were interested in back in 2016-2019, which is not a big help if you are trying to capitalize on current trends.
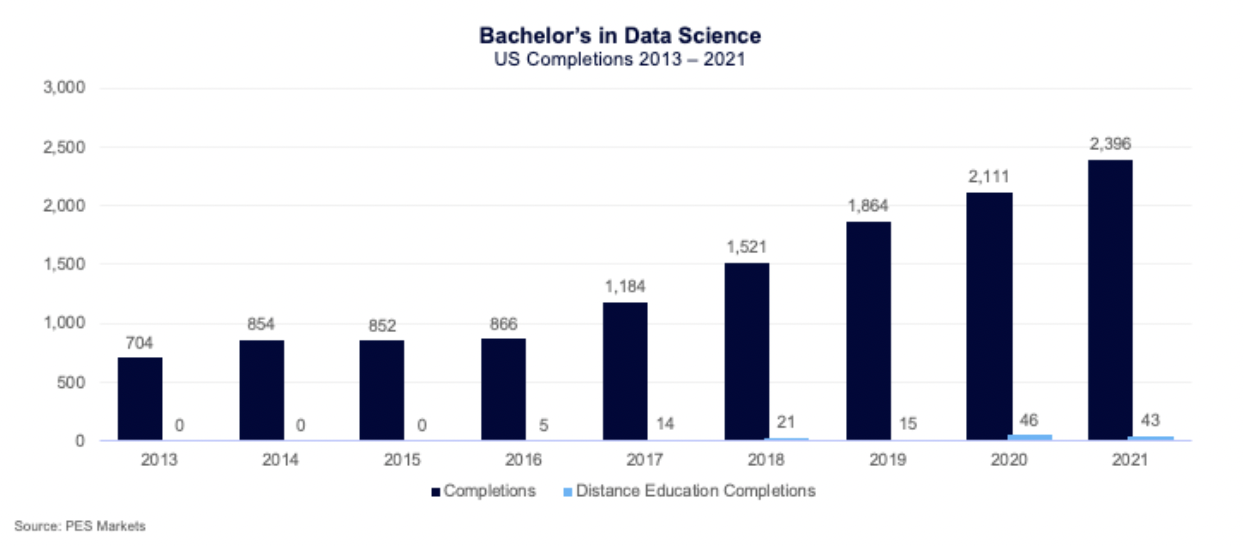
The IPEDS taxonomy only updates about every five years, so emerging disciplines can remain invisible for many years.
Data Science is a case in point; after years of growth, it finally appeared, full-grown from the brow of Zeus, in 2021 with 2,439 completions¹.
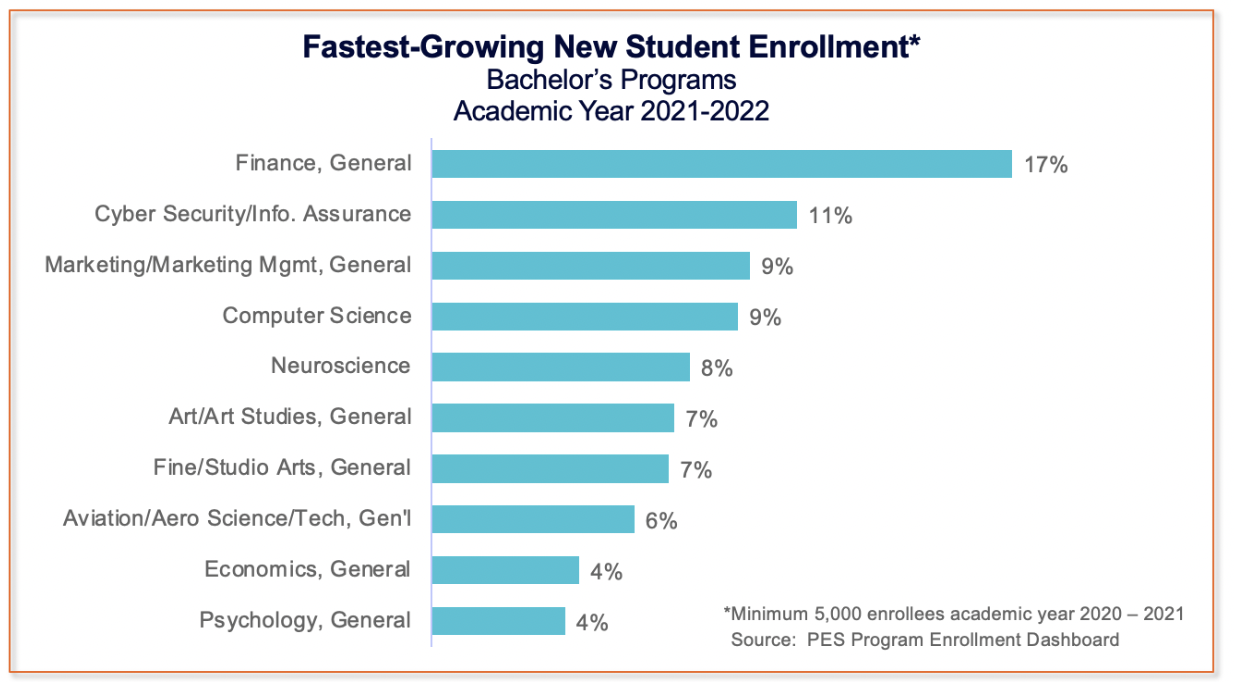
Enrollment Data: Programs Students Enroll In
Enrollment data from National Student Clearinghouse tracks enrollment by award level, programs, and student location (last known address). It’s a good indicator of current interest in academic programs. However, on its own, this source won’t tell you if the students stayed in the program through graduation.
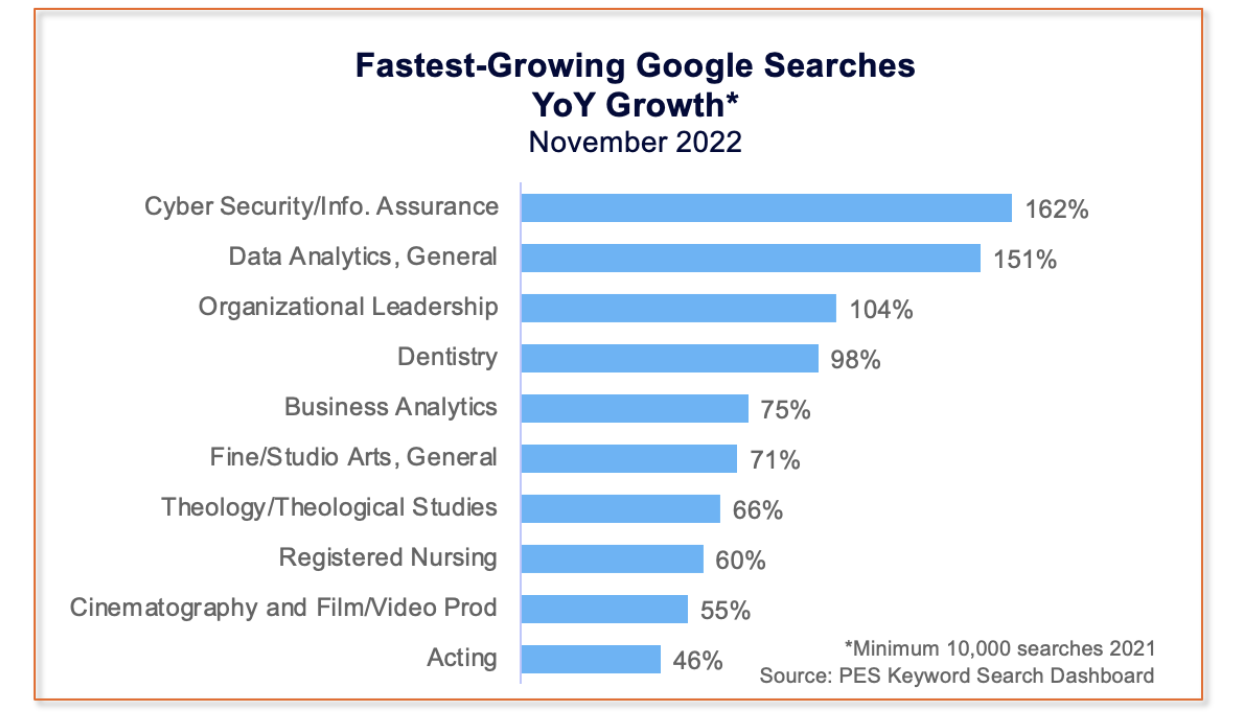
Google Search Volume: Programs Students Search For
We’re all familiar with Google because many of us use it every day, usually to look something up. It’s a wonderful data source because the information is free and it’s up to date. For program evaluation purposes, it indicates what programs prospective students are searching for and may enroll in next year. It also includes new and emerging programs that might not appear in enrollment and completion data.
Multiple Data Sources for Academic Program Analysis
Here is an example of how using a single-source reactive approach can result in uninformed academic program portfolio decision-making.
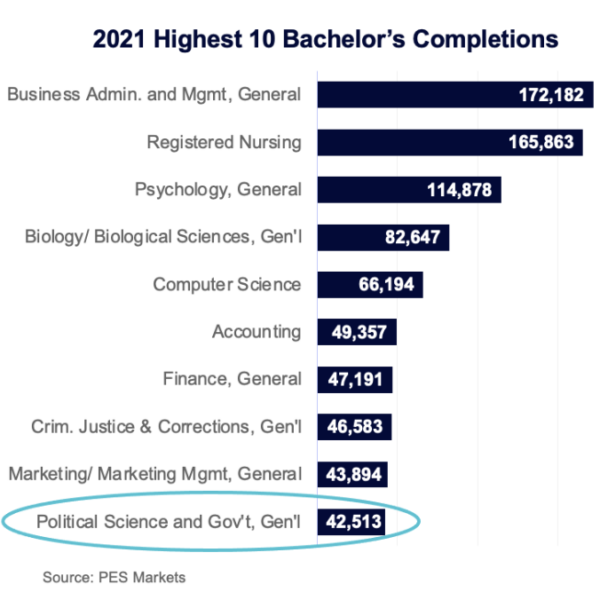
Let’s look at a program with high completions. You may think this is a strong program, but if enrollment and Google searches are down, there may be limited room for growth.
In November 2022, Google Keyword Searches for Political Science ranked 142nd of all bachelor’s programs. For 2021-2022 enrollment, it ranked 18th. The data indicating the most current student demand – Google – is low.
Properly evaluating student demand for your programs requires more than one metric so you can understand demand across different stages of the student lifecycle. Google search volume, enrollment, and completion data provide a complete picture of the student demand for your academic offerings so you can make better-informed decisions about programs to start, stop, or grow.
¹Previously, Data Science was buried in CIP codes like Multi/Interdisciplinary Studies and Business Statistics.