
Athletic departments at colleges and universities make major decisions about what sports teams they offer and, from time to time, which conference to participate in. Each year, they review whether to start, stop, or grow their teams, typically using internal data (e.g., participants, expenses, etc.). The next step should be to use external benchmarking data for comparisons with peer institutions.
Below is an example of benchmarking data for men’s ice hockey in the Big Ten Conference. Since Covid-19 forced the season’s cancellation for some teams, we have used pre-pandemic data from the 2018-2019 academic year.
Conference Comparison
Several hockey teams participate in a hockey conference separate from the school’s primary conference for other sports. For example, Notre Dame is a member of the ACC for other sports (except football, which is Independent). However, the ACC does not offer hockey; therefore, its men’s hockey team joined the Big Ten.
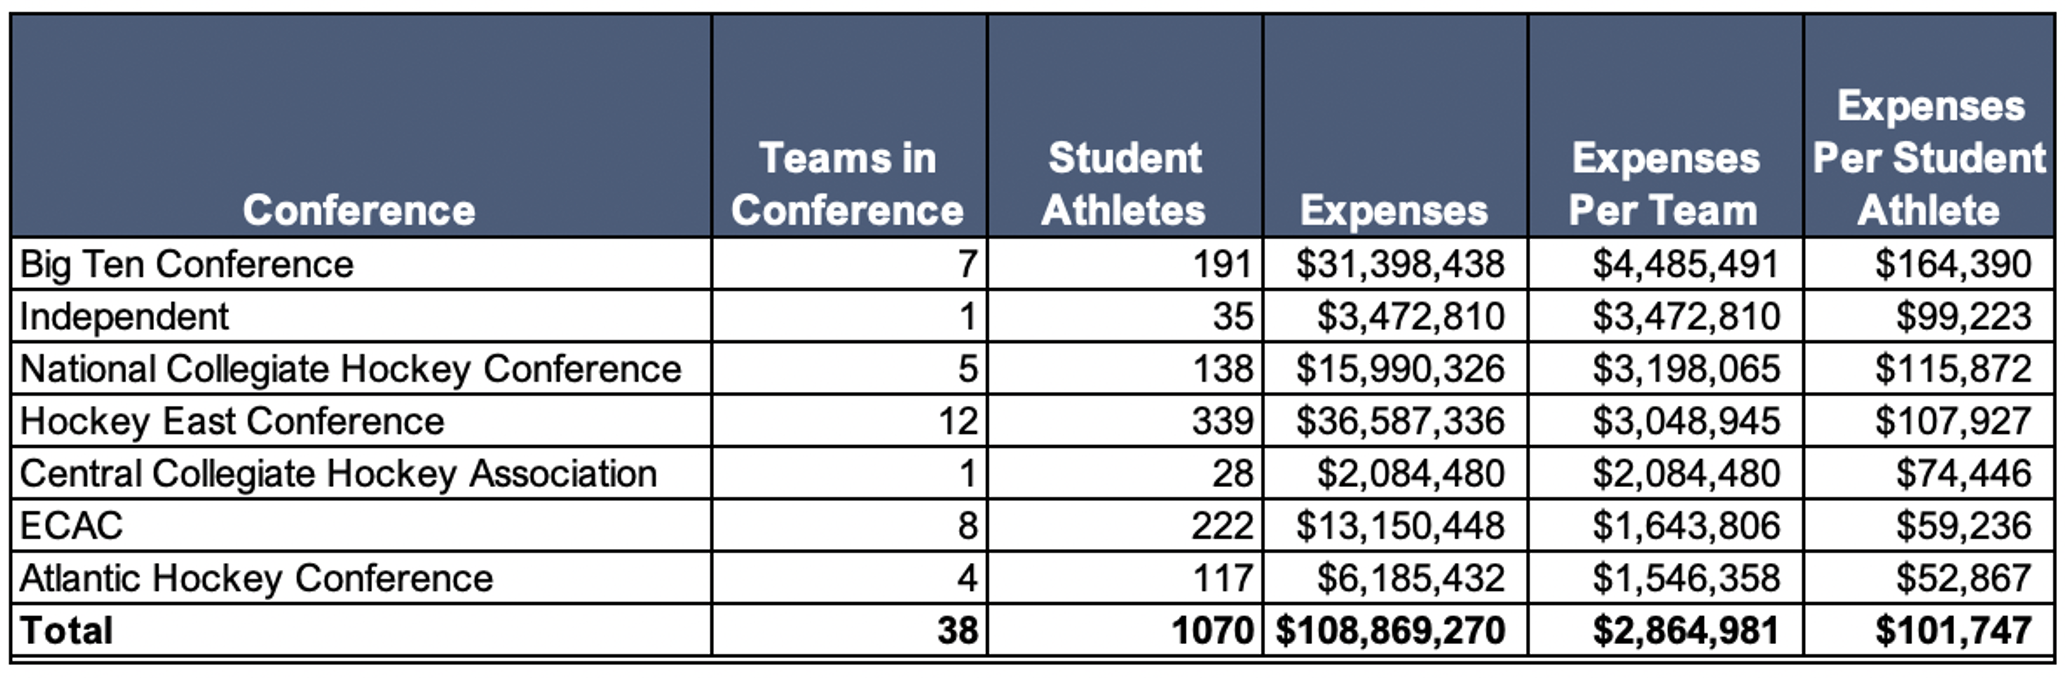
This decision came at a cost. Among Division One hockey conferences, the Big Ten Conference had the highest expenses per athlete at $164,390. The ECAC members spent just $59,236 per athlete – over 60% less than the Big Ten.
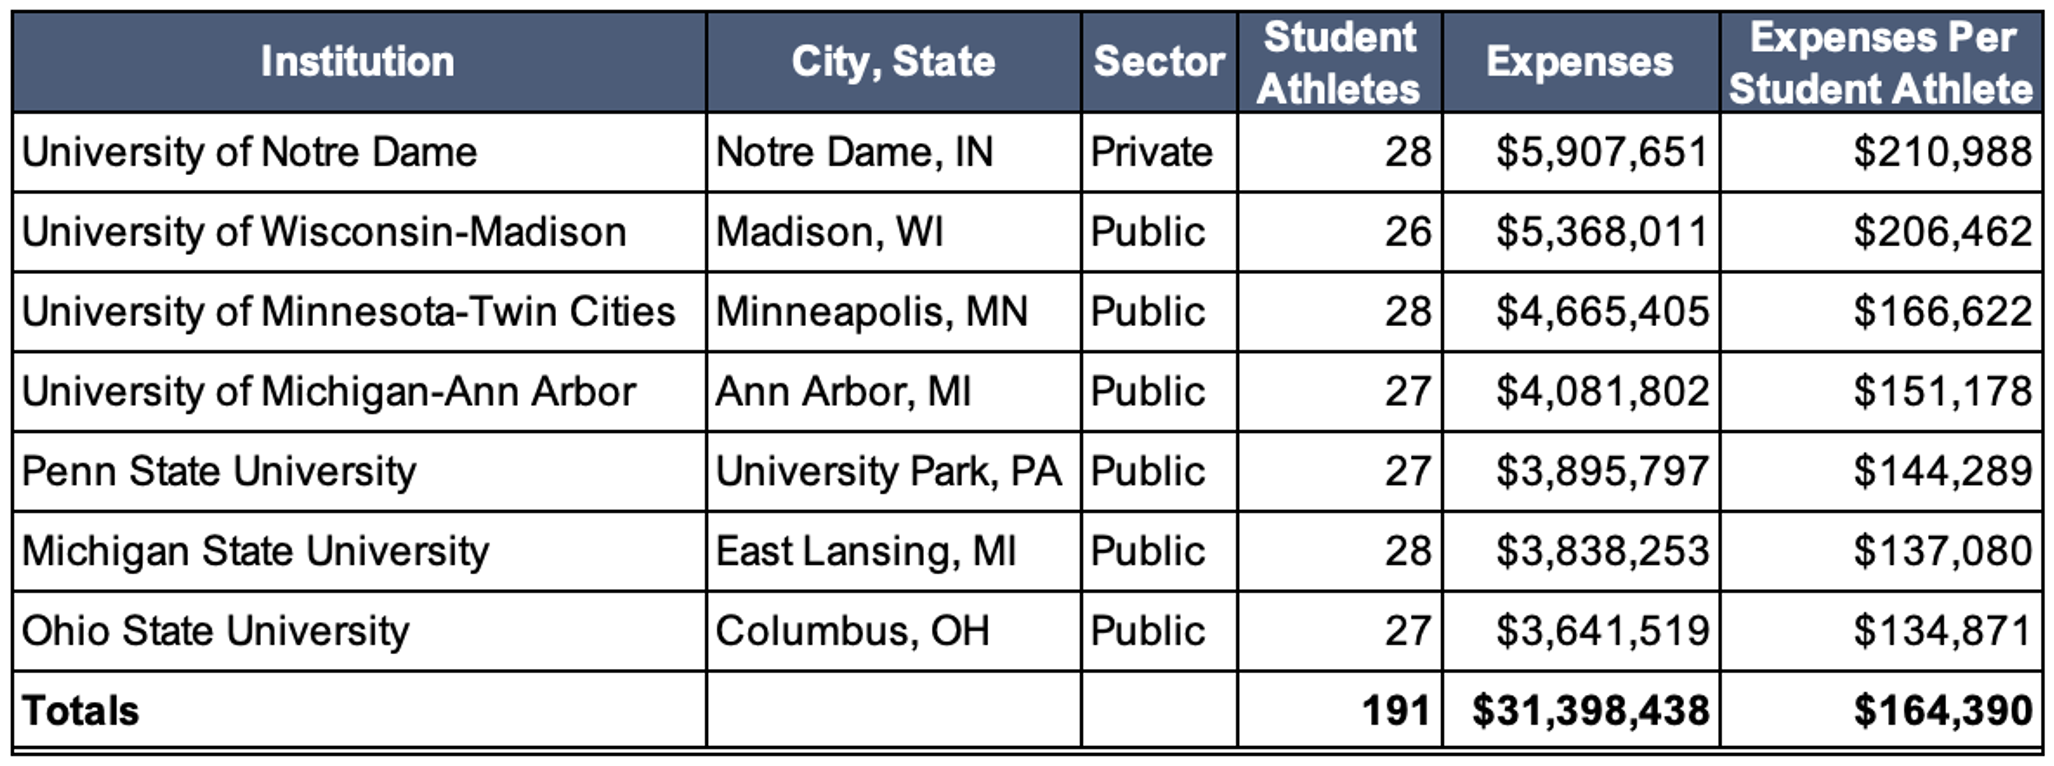
Big Ten Participation and Expenses
The average roster size was 27.3 student-athletes and four coaches. Teams averaged $4.5 million in expenses or $165,000 per student-athlete. Below is a breakdown of total expenses-by-team. Expenses include appearance guarantees and options, athletically-related student aid, contract services, equipment, fundraising activities, operating expenses, promotional activities, recruiting, salaries and benefits, supplies, and travel.
Benchmarking can be applied at schools considering a conference change or just looking to add new sports based on market demand and program economics. Data is available for schools at Division I, II, III, or community college levels and for men’s, women’s, and coed sports. These decisions also affect enrollment in academic programs as certain sports attract students who major in specific programs. At Gray DI, we are developing a dashboard and datasets to help schools understand the results of these decisions. Click here if you would like to learn more.