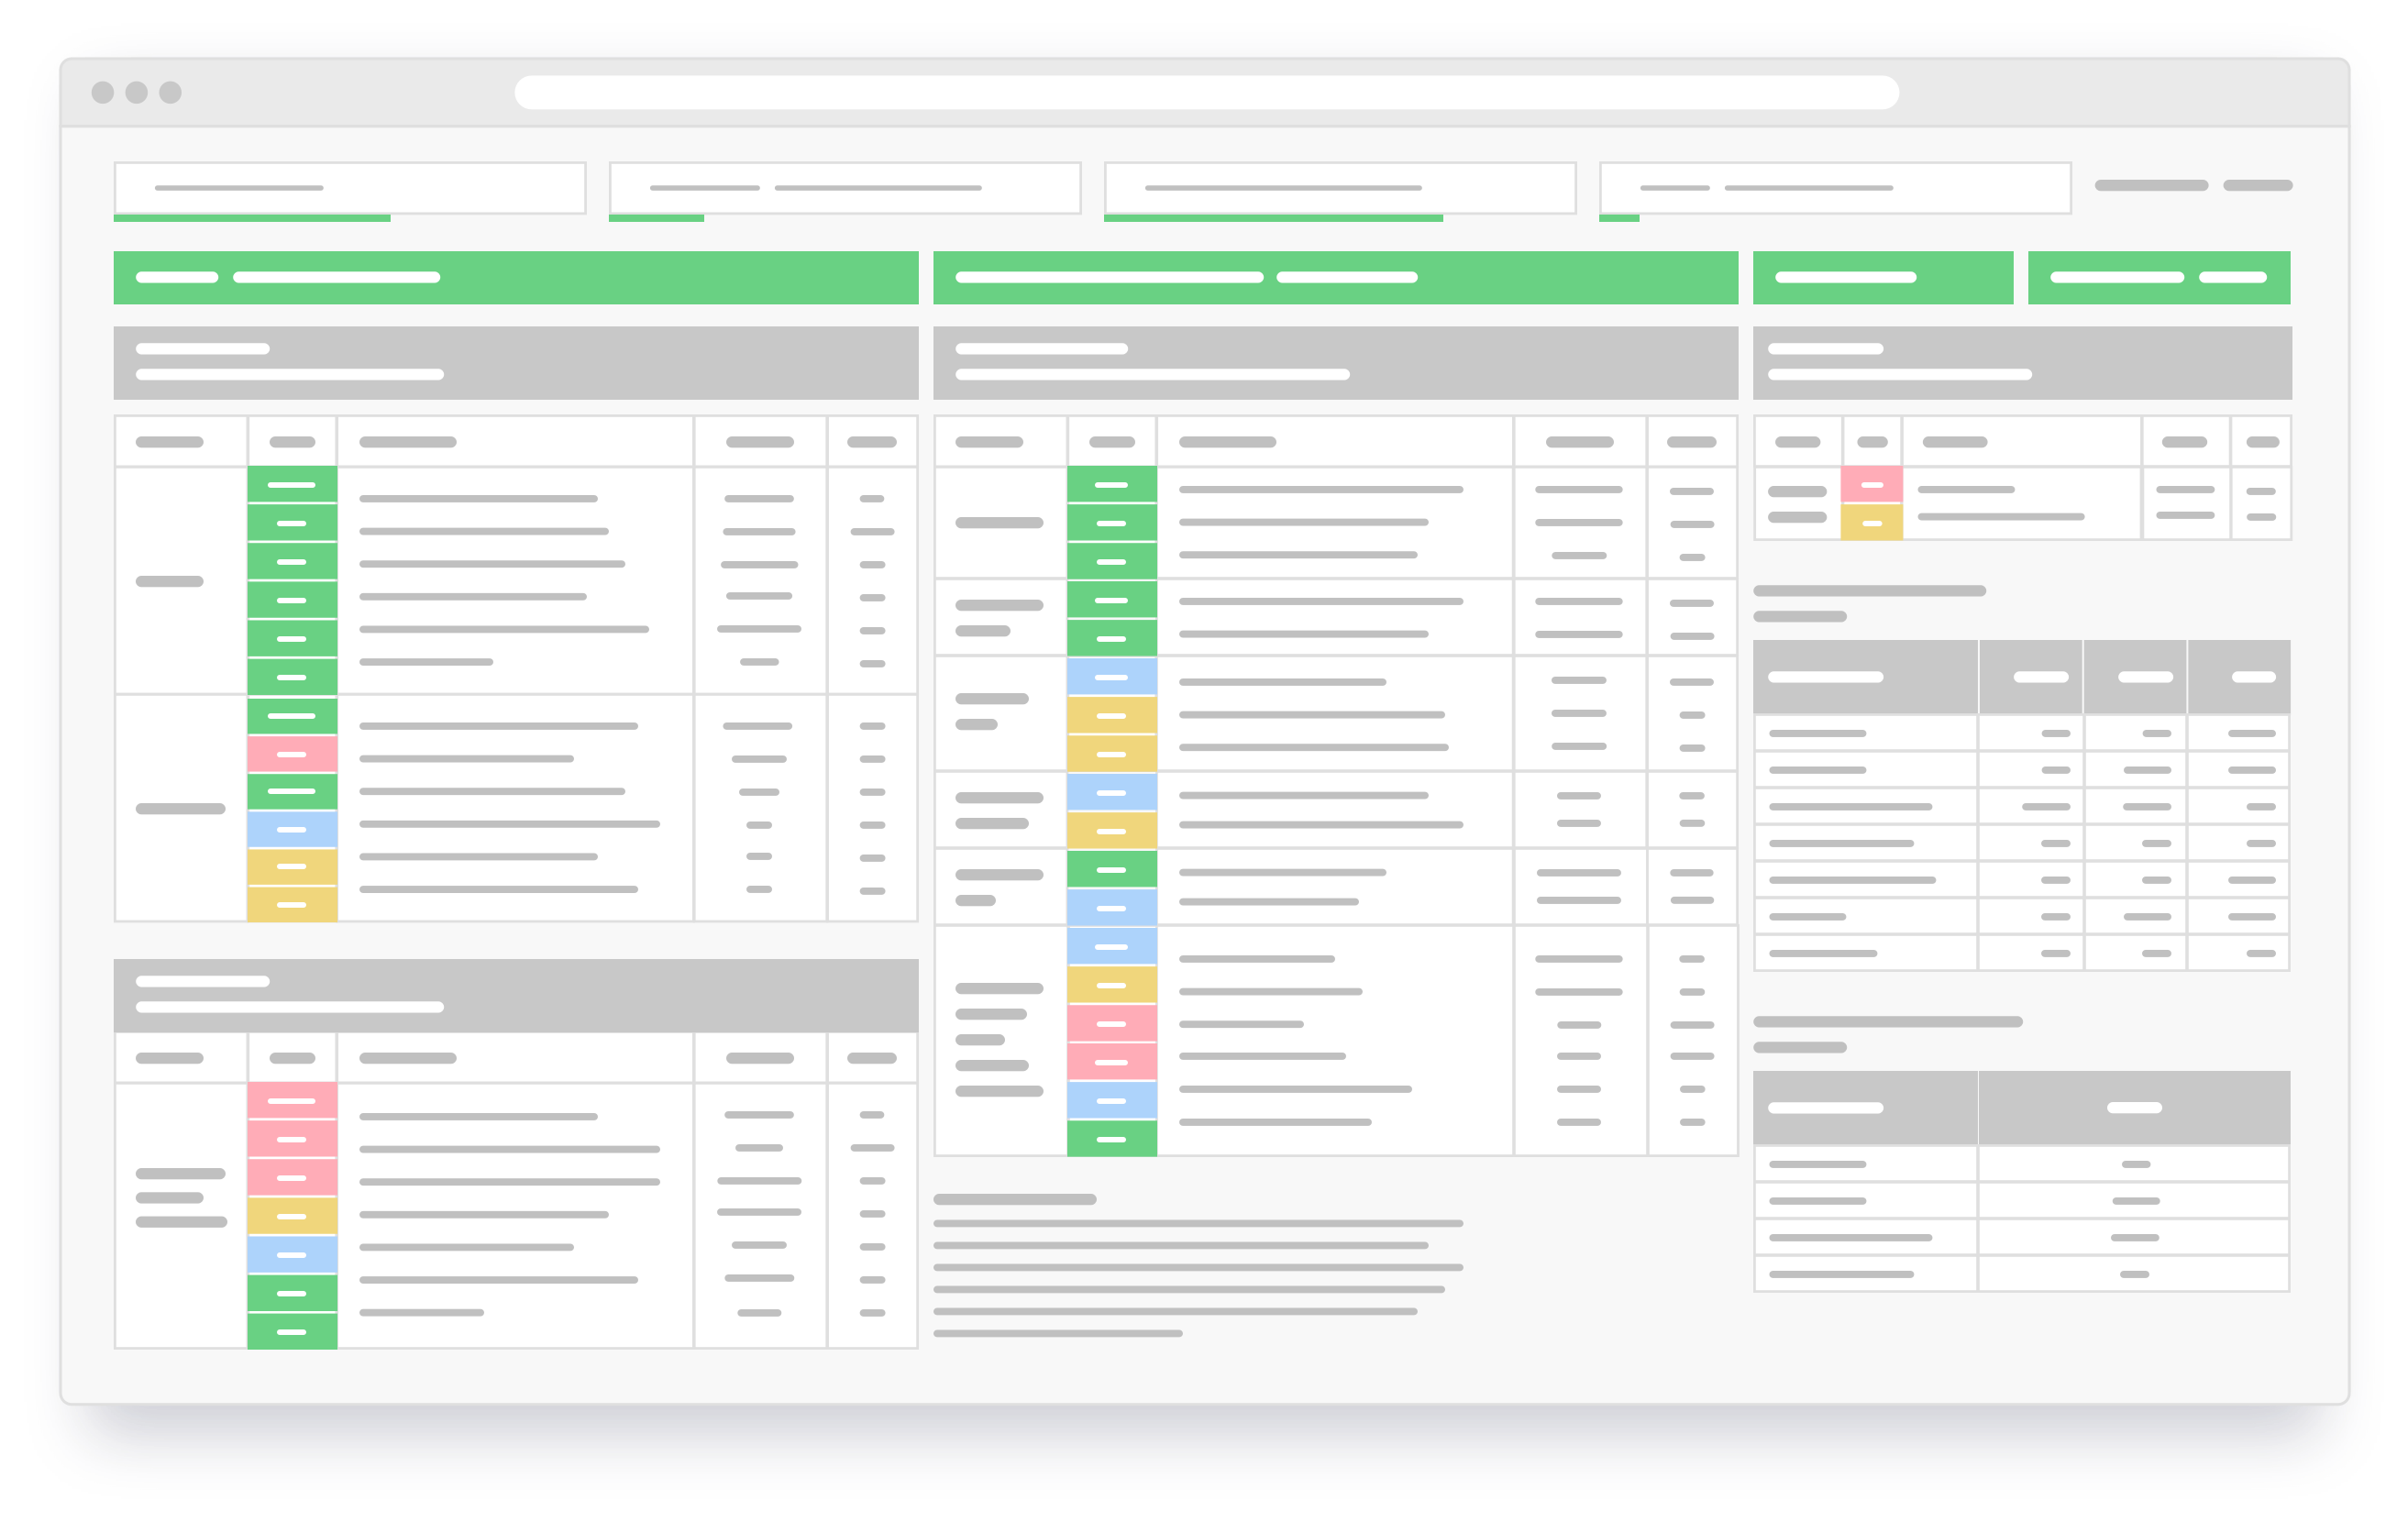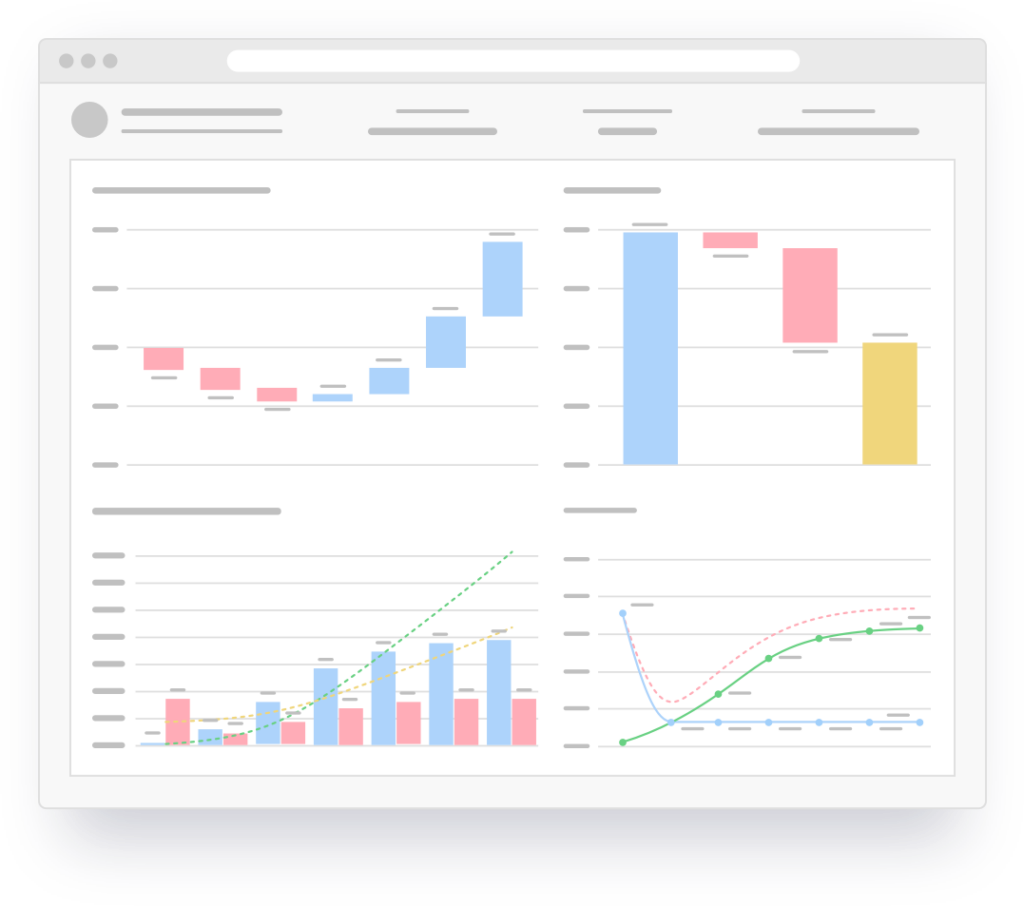
For over 1,500 academic programs, PES Markets provides the best available information on student demand, competition, wages, skills, and jobs. Unlike other sources, PES analyzes data on careers by academic program and aligns programs with the jobs graduates actually get – by degree level. It provides data on student demand so you can identify opportunities for growth and efficiency. It allows you to evaluate hundreds of programs in minutes or drill down for the details on one program.
Streamlined Program Evaluation
Access over 40 essential metrics, including student demand, employment opportunities, and competitive intensity.
Customized Data Sets and Scoring
Tailor market definitions and scoring to align with your institutional priorities. Use your scoring to identify opportunities to start, stop, or grow programs.
Comprehensive Reporting and Analysis
Pull custom reports in seconds, export data to Excel, and download visualizations in PNG format.
Unparalleled Data
Gain insights into student demand, competitive intensity, employment, skills, wages, degree fit.
Learn more about Gray DI's PES Markets Software
- Enables data-informed decision-making
- Involves institutional leaders, relevant deans, faculty, and functional managers
- Includes large group discussion and small breakout groups
- Builds consensus among key stakeholders
- Accelerates implementation by months–or years


